Chapter 7: Data Storytelling
Using data to tell a compelling story turns raw numbers and statistics into a narrative that engages and informs your business strategy.
Let's look at that in a bit more detail 👇

Contents
Back to startData Storytelling
As Jeff Ignacio stated:
‘You must pair the data with anecdotes because while the data itself should be the empirical truth, we all know that at times there’s more to the story, and that’s where the anecdotes come in.’
‘That’s where the qualitative aspects of what you learn from your SDRs, your sales team, your marketers come in. They're bringing in that rich insight that might not leap off the page in terms of a data point, but combined together, you get strong insights into how a business can perform.’
Using data more technically involves employing advanced data analytics techniques and tools to extract insights.
The benefits of data storytelling
1. Customer lifecycle mapping
One of the most important aspects of RevOps is understanding the entire customer lifecycle. Data is critical in mapping this journey.
By tracking and analysing customer interactions and behaviours, organisations can gain insights into what motivates their customers to purchase, renew a subscription, or become brand advocates.
As Andy Mowat, CEO of Gated, shared:
‘Our head of account management didn’t know his win rate for his new product and how long his sales cycles take. He could put his finger in the wind but didn’t know that conclusively.’
‘You need to be able to snapshot your data in that data warehouse, every evening or at some interval. That way, you’re able to tell a story in a much better way. You can look at the opportunity field history and tell that story.’
Through data insights, companies can tailor their marketing strategies, sales approaches, and customer success efforts to meet customer needs at each lifecycle stage.
2. Sales and marketing alignment
Jeff Ignacio said:
'One truth that I think is important is uncovering the insights that are somewhat hidden from siloed teams. And with that data is often sitting somewhere and needs to be brought up to the rest of the company.’
Data binds together sales and marketing by sharing a common data set and metrics.
Data analytics enable organisations to determine which marketing campaigns generate the most leads and conversions.
This allows marketing teams to focus their efforts on what works, leading to a higher quality of leads. Simultaneously, sales teams can use this information to prioritise leads, resulting in more effective sales motions
3. Forecasting and predictive analytics
Data can enhance forecasting and predictive analytics.
Historical data can be analysed to identify patterns and trends that help predict future revenue streams. This insight allows organisations to make informed decisions about resource allocation, hiring, and strategic planning.
Additionally, predictive analytics can help organisations identify potential problems in their pipeline.
Andy Mowat highlighted the importance of this:
‘If you want to see pipeline coverage in real-time at any point, you need data, you need to have that data out. That way, we could look at how pipeline coverage works and how it's building.’
'You can see when pipeline has spiked, or that pipeline has just dropped and be able to ask what happened. And so it creates the right cadence across all the different functions.'
4. Revenue optimisation
The ultimate goal of RevOps is to optimise revenue growth.
Through data analysis, organisations can identify which customers provide the highest lifetime value, which products or services generate the most revenue, and which sales and marketing channels are the most effective.
This allows organisations to allocate their resources more efficiently, focusing on high-value customers and channels.
Examples of Data Storytelling
Data mining
This involves the exploration of large datasets to discover patterns, trends, or anomalies.
It identifies buying patterns in customer data. You can discover that customers who purchase certain products are more likely to buy complementary items, which can inform product recommendations.
Machine learning
Machine learning algorithms use historical data to make predictions or classify data points into different categories.
A/B testing
This involves comparing two or more versions of a webpage, email, or marketing campaign to determine which one performs better.
A social media platform may conduct A/B testing to assess the effectiveness of two different ad creatives, for example. By showing one ad to a portion of their user base and another to a different group, they can analyse engagement metrics to determine the most effective ad.
Data visualisation
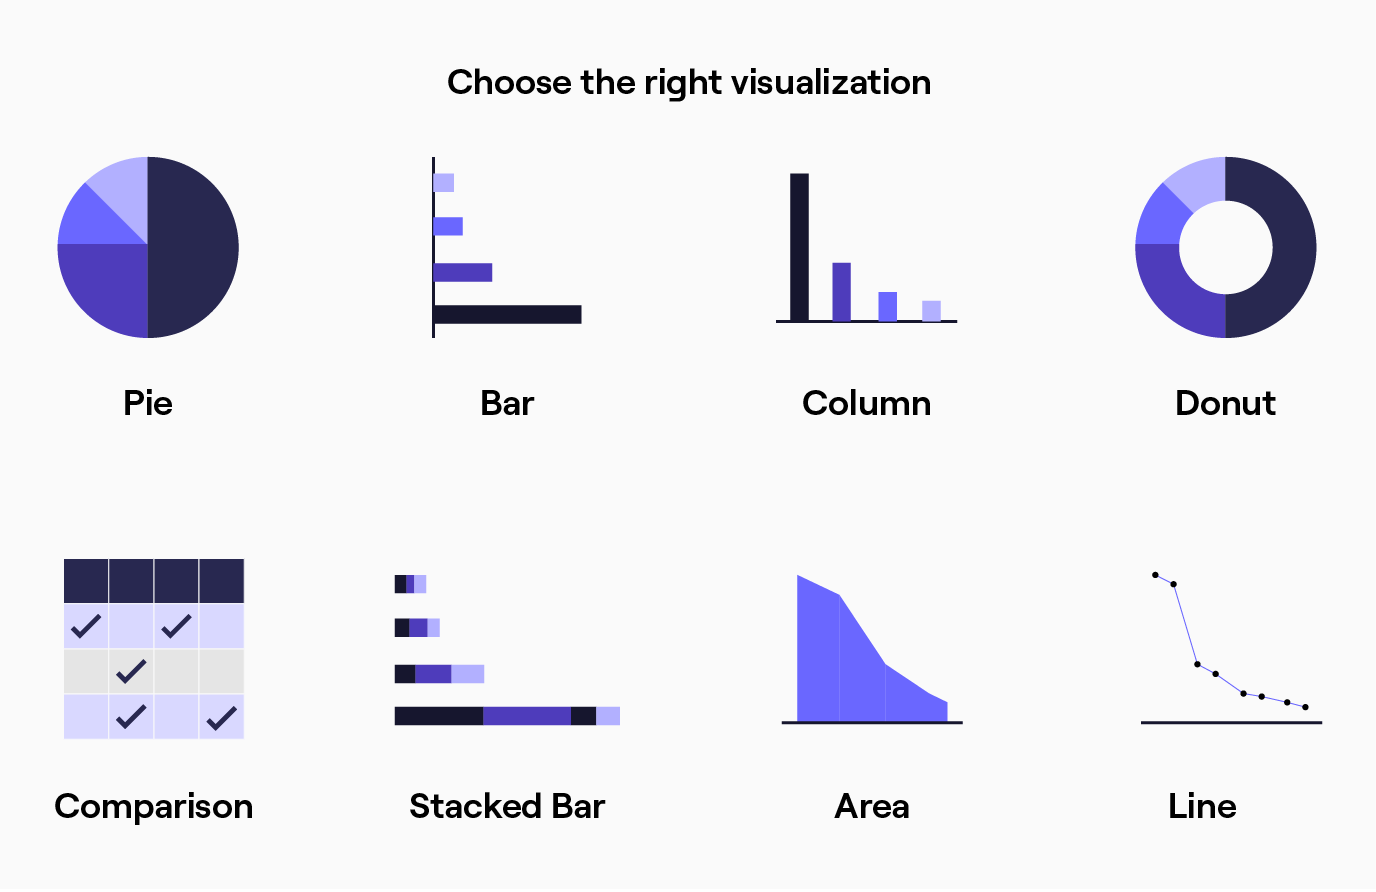
Data visualisation techniques, such as charts and graphs, are used to present complex data in a visually comprehensible way.
For example:
Sales managers can create interactive dashboards to visualise sales performance across different regions, products, or periods. This enables them to identify trends and make strategic decisions quickly.
Cluster analysis
This groups data points into clusters or segments based on similarities or shared characteristics.
This helps segment customer bases. By identifying different customer segments, you can tailor marketing strategies for each group, improving campaign effectiveness.
Closing thoughts
These are just a few examples of how data analysis techniques can be applied to different domains.
Leveraging these techniques enables organisations to extract valuable insights, make informed decisions, and gain a competitive advantage.